Saturday, December 31, 2011

The scale of atoms

Saw this on Phil Plait's Bad Astronomy blog and loved it.  Phycisist Brian Cox on a BBC show called "A Night With the Stars" talking about why atoms are mostly empty space.  Watch it!


As Plait says "Post script: can you imagine a show like this running on American TV? No, I can’t either..."   God forbid, with 100+ cable channels, there should be some intelligent program material (which I why I don't even subscribe to cable TV).

In my introductory science classes, I like to explain to students how atoms are really small, mostly empty space, and not at all like they commonly imagine.

Let's look at the size of a typical atom. Nothing is more typical than hydrogen - the most abundant element in the known universe. Hydrogen is simple - it's just one negatively charged electron orbiting a positively charged proton (let's ignore electrically-neutral neutrons for now).

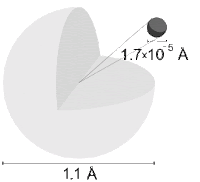
Below left is a simple model of a hydrogen atom. This type of model is called the Bohr model after Danish physicist Niels Bohr. While this is how most people visualize atoms - as hard, little electrons orbiting a nucleus like planets around a star - it's completely incorrect as a physical model. We'll come back to that in a bit.
    

Above right is an image from Wikipedia showing the diameter of the proton in a hydrogen atom (1.7 x 10⁻⁵ Å) and the diameter of the atom itself which is the orbital shell of the electron (1.1 Å).

For those of you unfamiliar with angstroms (Å), one angstrom is equivalent to 10-10 meters.

Why no diameter for the electron?  Well, it's complicated and physicists generally treat it as a point charge.  We can say that the mass of the electron is 1,836 times smaller than the mass of a proton, however.  That's like comparing my weight to something weighing 2 ounces.

Now, let's look at the relative sizes of the nucleus and orbital shell for a hydrogen atom.

     (1.1 Å / 1.7 x 10⁻⁵ Å) = 64,706

In other words, in a hydrogen atom, the electron orbital is 64,706 times the diameter of the proton in the nucleus.  Let's make that easier to visualize.  Image we blow up the proton to the size of a golf ball.  Wikipedia gives the minimum diameter of a golf ball as 43 mm or 4.3 x 10⁻² m.

     [(1.7 x 10⁻⁵ Å) / (4.3 x 10⁻²m)] = [(1.1 Å) / X]
     X = [(1.1 Å) (4.3 x 10⁻²m) / (1.7 x 10⁻⁵ Å)]
     X = 2,782 m
     Divide diameter by 2 for the radius = 2,782 m / 2 = 1,391 m

That's 1.4 km or 0.9 miles.  In other words, if the proton nucleus of a hydrogen atom were the size of a golf ball, the electron would be orbiting almost a mile away!  That's why we say atoms are mostly empty space!

Atoms are also really, really small.  How small?  Let's compare the size of a hydrogen atom to the size of a penny.  Once again, Wikipedia to the rescue telling us that a U.S. penny is 19.05 mm in diameter (1.9 x 10⁻² m).

      (1.9 x 10-2 m / 1.1 x 10⁻¹⁰ m) = 172,727,273

A penny is 173 million times the diameter of a hydrogen atom!  How big is a penny if we blew it up 173 million times?

     1.9 x 10-2 m x 172,727,273 = 3,281,818 m = 3,281 km

For reference, the diameter of the Moon 3,475 km.  Let's suppose a careless astronaut dropped a penny on the surface of the Moon.  The size of that penny compared to the Moon is about the same as the size of a hydrogen atom compared to a penny!

Back now to the Bohr model of the atom.  The image of electrons orbiting a nucleus like the image at left is useful for understanding how atoms bond, it really does give us the wrong idea.

The modern, quantum mechanical model of an atom has variously-shaped electron "clouds" around the nucleus with electrons essentially behaving as waves.  Electrons can only occur in certain orbitals because they're essentially like standing waves as Brian Cox explains in the video.  To really understand this, you have to understand the mathematics of the Schrödinger equation.

Reality gets very strange at the atomic scale!
Friday, December 30, 2011

The 1700 Cascadia Quake

Since I just reviewed Jerry Thompson's Cascadia's Fault book, I thought I'd also say a few words about the massive earthquake which occurred on the Cascadia subduction zone back in 1700.  Before we do that, let me just remind everyone what a magnitude 9.0 earthquake is like when it occurs on a subducting plate under the seafloor.

On March 11 of this year, an earthquake of this magnitude occurred beneath the ocean floor 43 miles east of the Oshika Peninsula of Japan.  The quake and resultant tsunami killed over 15,000 people and resulted in an economic cost of over 200 billion US dollars.


On December 26, 2004, a similar type of earthquake occurred just off the west coast of Sumatra in Indonesia.  The resultant tsunami killed over 200,000 people around the Indian Ocean and caused tens of billions of dollars in damage.


Similarly large earthquakes have occurred along offshore subduction zones in 1985 in Mexico, 1964 in Alaska, and 1960 in Chile.  They're not especially uncommon.

Queule, Chile, before and after the 1960 earthquake and tsunami

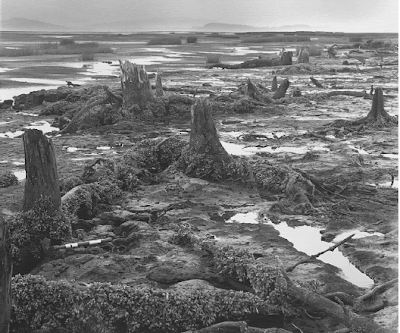
In the late 1980s and through the 1990s, researchers like USGS geologist Brian Atwater started noticing evidence for a very large earthquake along the Pacific Northwest coast.  Groves of trees were found submerged into salt water and killed when the land suddenly subsided.  Radiocarbon dating and studies of growth rings in the trees narrowed the time of the earthquake to around 1700. 

Submerged cedar forest - Willapa Bay, Washington

A connection was then made to historical records of a tsunami striking numerous villages in Japan on January 27, 1700 (leading to a date of the earthquake of January 26).

Painting of 1854 Hiro Village, Japan tsunami

Pacific Northwest native peoples also had legends of a large earthquake and tsunami (although not specifying a date).  Many of the stories are wrapped in stories of battles between mythological creatures like Thunderbird and Whale. 

Here's one matter-of-fact account from at 1864 diary entry by James Swan, the first schoolteacher on the Makah reservation at Neah Bay near the Straits of Juan de Fuca...

Billy also related an interesting tradition. He says that "ankarty" but not "Irias ankarty" that is at not a very remote period the water flowed from Neah Bay through the Waatch prairie, and Cape Flattery was an Island. That the water receded and left Neah Bay dry for four days and became very warm. It then rose again without any swell or waves and submerged the whole of the cape and in fact the whole country except the mountains back of Clyoquot. As the water rose those who had canoes put their effects into them and floated off with the current which set strong to the north. Some drifted one way and some another and when the waters again resumed their accustomed level a portion of the tribe found themselves beyond Noothu where their descendants now reside and are known by the same name as the Makah or Quinaitchechat. Many canoes came down in the trees and were destroyed and numerous lives were lost. The same thing happened at Quillehuyte and a portion of that tribe went off either in canoes or by land and found the Chimahcum tribe at Port Townsend.

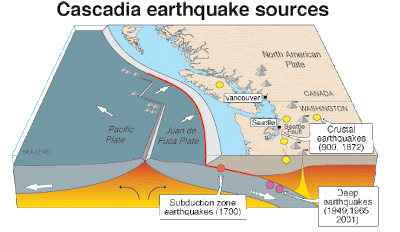
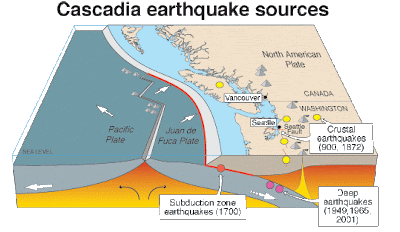
Now let's review the following image from my previous post.


See that red dot labeled "Subduction zone earthquake (1700)"?  Can a magnitude 9+ earthquake and resultant tsunami happen again along this subduction zone?  Absolutely!  Large sections of this megathrust fault have been basically locked for 300 years or so and there is a chance that it will let go in our lifetimes.

A piece of advice... If you're on a Pacific Northwestern beach or live in a low-lying area, and you feel a large quake with prolonged shaking, run, don't walk, to higher ground!

Wednesday, December 28, 2011

Cascadia's Fault - Part 2

Finishing my review of Cascadia's Fault by Jerry Thompson.  Read yesterday's post if you haven't already and then come back here...

My last post illustrates the biggest problem with the book - not one diagram of the Cascadia subductions zone.  Not one map.  Not one cross-section.  The purpose of the book is to make the public “sit up, pay attention, and get ready” yet non-geologists will simply not understand the geological explanations Thompson provides.  It would have been trivially easy to include these illustrations, and Thompson does provide a few pictures of historical earthquakes, like the 1964 Good Friday quake in Alaska, so it's puzzling why he didn't do so.

One strength of the book is the historical background but even this comes with a caveat.  Geologists began recognizing the danger of the Cascadia subduction zone around the time the modern theory of plate tectonics was being developed.  It was an exciting, and sometimes acrimonious, time in geology.  Thompson covers this historical development in detail, almost too much detail at times, yet fails to capture this excitement.  I honestly found much of the central part of this book to be tedious reading and started skimming even though I should have been interested.

Finally, the book was a bit sensationalistic (Thompson was trained as a journalist and he wants to sell documentaries).  The subtitle "the coming earthquake and tsunami that could devastate North America" is a bit overblown and the last part of the book is an absolute worst-case scenario of what could happen if a major earthqauke occurred along this fault zone.

So, bottom line, I can't recommend this book that much but it is an important issue and an interesting geologic feature which could cause great devastation when it lets go some day.  If you're still interested in reading it, borrow the book from the library like I did.

Tuesday, December 27, 2011

Cascadia's Fault

I recently read Cascadia's Fault: The Coming Earthquake and Tsunami that Could Devastate North America by Jerry Thompson (Counterpoint, 2012).

Thompson is a documentary filmmaker living outside of Vancouver in British Columbia who's produced and narrated several television documentaries on the Cascadia fault for the CBC.  Thompson's interest in the Cascadia subduction zone was due, in large part, to his home being located in an area that might be directly affected by a large earthquake along that fault zone.

I have to confess that I wanted to like this book, but I'm afraid I didn't.  First a little background...

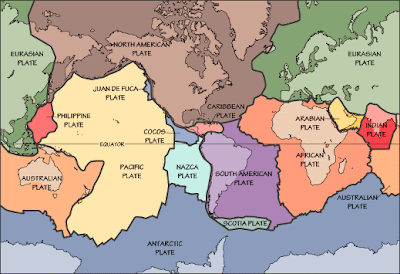
I don't believe regular readers of this blog need much of an introduction to plate tectonics. The Earth's rigid outer shell, called the lithosphere, is split into a number of tectonic plates which all move relative to one another.  Virtually all of the continental United States and Canada, with the exception of a small sliver of southern California, is sitting on the North American Plate.


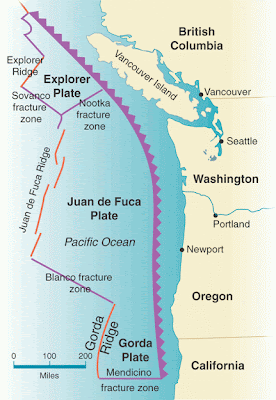
Just offshore of the Pacific Northwest (Northern California, Oregon, and Washington) is a small plate of oceanic crust called the Juan de Fuca Plate.

Since I love tangential stories, I'll share the following.  Juan de Fuca was a Greek navigator (Ioánnis Fokás) who sailed for Spain to look for the fabled Strait of Anián, a supposed Northwest Passage across the top of North America, and claimed to have discovered it in 1592.  The English captain, Charles William Barkley named the Juan de Fuca Strait in 1787 in his honor believing that's what Juan de Fuca described from his voyage almost 200 years earlier.

Anyway, here's a closer view of the region.  The north-south purple barbed line just off the coast of the Pacific Northwest is the Cascadia Subduction Zone - the trench down which the Juan de Fuca plate subducts as it pushes eastward, away from newly-forming ocean crust at the Juan de Fuca and Gorda Ridges, and as the North American Plate moves westward away from the distant mid-Atlantic Ridge on the opposite side of the continent.


Here's an oblique-view of the region showing the subduction of the Juan de Fuca Plate down the Cascadia Subduction Zone beneath North America.


Melting of the subducting plate provides magma for the Pacific Northwest chain of volcanoes comprising the Cascades Range.  Mount Lassen, Mount Shasta, Crater Lake, Mount Hood, Mount St Helens, Mount Rainier, and others have all erupted in historic times and will all erupt again (many people living in the shadows of these beautiful mountains are in a state of deep denial about that fact).

Subduction zones are also the locations of some of the largest and most destructive earthquakes on Earth.  So, while the San Andreas Fault is the one in the public's consciousness, the Cascadia Fault is potentially just as deadly (if not more so).

Let me just add that if Thompson, the author of Cascadia's Fault, had given a background like I did above, with drawings of the plates and subduction zone, I would have reviewed his book much higher than I will tomorrow, when I finish this discussion!

Monday, December 26, 2011

Gastroenteritis for Christmas

One of the downsides of being the parent of young children is that they occassionally get sick.  Then they make you sick.  My 10-year-old son picked up a stomach virus last week and gave it to me just in time to have a low-grade fever all day on Christmas Eve and unable to enjoy all the good food and beverages on Christmas Day (a turkey dinner with all the fixings at my house).

On the positive side, The worst of it is only 24 hours and it's mostly gone after a couple of days.  I also lost a couple of pounds over Christmas weekend rather than gaining weight as I normally would have done!

I've been feeling bad about not keeping the blog active lately but really stressed over the last few weeks of the semester.  Hopefully, things will be back to normal (relatively, at least) soon.  I've been reading some interesting books lately on geology and hope to share some of that this week.

Monday, December 19, 2011

Ding, dong, the evil little dwarf is dead

Kim Jong-il, the evil little dwarf that has enslaved North Koreans for several decades has assumed room temperature.  The only sad part is that it wasn't the result of a bullet to the head.

The late Christopher Hitchens had an interesting article in Slate a while ago titled A Nation of Racist Dwarfs which is worth a read.

And here's the famous image from space of the Korean Peninsula at night.  See South Korea all lit up (especially Seoul).  North Korea is pretty much all as dark as the Gobi Desert (the one bright light in Pyongyang).


What I am completely unable to understand are the brainwashed North Koreans weeping and wailing because "Dear Leader" is dead.


Boys and girls, no one on this Earth ever deserves to be worshiped as a god.  No one.  Ever.  Anyone who wants this is an egomaniac asshole.  You'd think no one would have to say this.  Evidently not.  People are just naturally stupid and easily led, I suppose.

Saturday, December 10, 2011

Japan tsunami dash cam footage

Just saw this dash cam footage from a guy who survived the Japanese Tohoku earthquake and tsunami last March 11 in his car.  Check out how quickly the water rose and the cars bobbing like corks...


Never underestimate the power of mother nature!

Tuesday, December 6, 2011

Selling science

A colleague brought the following New Scientist article, Science in America: Selling the Truth, to my attention recently (unfortunately, you need to register to read this article).

From the start of the article:
JOHN HOLDREN, science adviser to President Barack Obama, is a clever man. But when it comes to the science of communication, he can say some dumb things. In January, Holdren welcomed the prospect of climatologists being called to testify before Congress: "I think we'll probably move the opinions of some of the members of Congress who currently call themselves sceptics, because I think a lot of good scientists are going to come in and explain very clearly what we know and how we know it and what it means, and it's a very persuasive case."
The article explains that this is the "deficit model" of science communication, which assumes that opposition to issues like climate change result from a lack of knowledge about the subject.  In other words, we just need to "educate them" and the opposition will be convinced.

Well, of course it's not that simple.  The article claims, and I concur, that all of us "filter and interpret knowledge through our cultural perspectives, and these perspectives are often more powerful than the facts."  Obvious examples of this are the opposition to the concept of biological evolution from many Evangelical Christians and the misguided belief that vaccines cause autism by many on the other side of the political spectrum.  There's even evidence that education may strengthen our cultural biases, not weaken them as you might expect.

The proposed solution?  If you want to change someone's mind on a controversial issue, find someone they identify with to make the argument.  In other words, don't expect Al Gore to change a Conservative's mind on climate change.  An Inconvenient Truth, with its not-so-subtle digs at George Bush, would be rightly viewed as having an ideological bias (even if the overall message was scientifically-based).  Don't expect an atheist will be able to convince Evangelical Christians that young-Earth creationism is not science.  Of course they don't believe God created man, they would think, the don't even believe in God.

To convince political conservatives that climate change is real, one needs to first repect their ideological beliefs, even if you don't share them and find conservative scientists to discuss the issue (they do exist).  Similary, Christian scientists (not the Mary Baker Eddy type!) are the ones best able to convince other Christians that young-Earth creationism is nonsense.

While I understand the necessity of talking about "selling science", it also makes me somewhat uncomfortable.  Many people in this country already hold to a type of postmodernism that claims scientific ideas are purely human constructs with no objective reality.  I mostly reject that idea as, I think, do most practicing scientists.  Scientific "truth" does not belong to the person making the cleverest argument as you might see on a Fox News type scenario of two talking heads arguing climate change as if all opinions on the issue are equally valid.  They're not.  The opinion of an atmospheric scientist with 30 years of research experience and peer-reviewed publications does not have the same weight as that of a state senator with a degree in business when it comes to climate change.

Monday, December 5, 2011

I'm back (I think)

I haven't posted anything for two weeks but needed a break.  Thanksgiving was a busy time and we're now in the home stretch for the fall semester (today starts the last week of classes and final exams are next week).

I've also has a staff member abruptly resign and I have a lot of work to deal with that (forensic recreation of what the person was working on at the time, hiring and working with a temporary replacement, writing a new job ad, etc).  We're also in the process of rewriting all department syllabi to make sure we have assessible student learning outcomes and assessment plans. Political bullshit - don't get me started on that topic.

I've been so stressed lately I've been having lots of dreams at night about working.  Nothing interesting or exciting in the dreams - just me working.  It sucks.  I wake up exhausted. Also working on losing some weight and cutting back on some of life's pleasures - good food and good beer.  Easy rule of thumb, if I like it and it gives me pleasure, it's bad for me.  If there is a god - he's cruel that way.

To top it all off, it's the "Holiday Season." One of my wife's nicknames for me (she has many, few flattering) is Scrooge. Yes, I hate Christmas.  Not Christmas Eve and Christmas Day, those are fine, it's nice to see the kids all excited about getting presents and the warm feelings associated with all of that (I'm not a monster).  What I hate is the lead up.  The raw, naked greed exhibited by retailers (and some people) in the weeks leading up to Christmas.  Let's celebrate the birth of Christianity's Messiah by buying shit we can't afford (and often the gift recipients don't really want or need) on credit.  If it was up to me, we would just celebrate the solstice at my house.

I totally avoid retail stores and malls in December (online shopping works just fine, thank you) but sometimes can't avoid the big increase in traffic (and holidays seem to bring out the worst drivers).  I also DESPISE having to hear "Christmas music" EVERYWHERE!!!  Do I really need to hear Jingle Bell Rock in fucking Starbucks or Dunkin Donuts or Panera when I want a cup of coffee?  Really?  It doesn't put me in the holiday spirit, it makes me even more grouchy than I already am since I'm usually in line behind people who appear to have all the time in the world (yes, I'm impatient too).  Is "Fuck you!" an appropriate response to "Happy holidays!" from some cheery cashier.  Probably not, but that's what I'm thinking.  I'm a very, very bad man.

So, anyway, I'll try to start posting more regularly again.  I'll even try to make the posts about science!  Just needed to vent a bit.

Monday, November 21, 2011

Pet peeves vis-a-vis geology students & math

A bit of a continuation of yesterday's post.  Pretty self explanatory.

Example 1
Student is told that to convert 12 kilometers to meters, all they need to do is multiply by 1,000 since there are 1,000 meters in a kilometer (something I thought they would have learned in 4th grade, but oh well).  Instead of just adding three zeros to 12 to obtain 12,000 meters, student whips out their $120+ TI-84 graphing calculator and enters 12 x 1,000!
Example 2
Student measures the mass of a mineral on a triple balance beam and gets a value of 203.5 grams.  The mineral displaces 29 ml of water and therefore has a volume of 29 cm3.  The density of the mineral is (mass/volume) or (203.5 g / 29 cm3) or 7.0172413793 g/cm3 as reported by the student.  Anyone see a problem with this answer?  The student's initial measurements, at best, have one decimal place precision while the answer is given to 10 decimal places (because that's what the calculator reported back).  The density should simply be reported as 7 g/cm3 (it was a hunk of galena - PbS).  The ten decimal place answer is nonsensical and was marked incorrect to the student's amazement.
Example 3
Student is trying to solve a problem.  A groundwater contaminant is slowly moving in the subsurface at an average rate of 1 in/day.  How many years will it take to move a mile (5,280 ft)?  Student makes a mistake and divides 5,280 by 12 to get 440 in.  Believes it will take a little over a year.  I ask student why they divided by 12.  Said it was because there are 12 inches in a foot.  I said you divided 5,280 ft by 12 in/ft and got 440 ft2/in. The units are nonsensical. If, however, they paid attention to the way I taught them to do unit conversions (a method they should have learned 10 years ago in middle school), they would have multiplied 5,280 ft by 12 in/ft to obtain 63,360 in which is a much better unit than ft2/in and the contaminant will take over 173 years to travel that distance (big difference!). Student looks at me blankly.
Example 4
In a similar type of conversion problem, student is off on their answer by several orders of magnitude because they multiplied instead of divided (e.g. answer is 4.3 km and student reports 430,000 km). No work is shown, I take off full credit. Student complains and wants partial credit.  My rule is no work shown, no partial credit.  I also ask them how a boss would respond to an error like this.  Would you like your doctor to be off by orders of magnitude when calculating a dosage?  An engineer when designing an aircraft?  A CPA doing your taxes?  Student hates me.
Example 5
When having to do a lab that contains nothing more complex than 8th grade math, student complains "I hate math!" and, despite my attempts at providing one-on-one extra help, declines and clearly copies the work from someone else. Fails lab final when forced to do the problems on their own without assistance.
These are all true examples from science majors in my Physical Geology laboratory course.  Sigh.

Sunday, November 20, 2011

Teaching math

I was in the doctor's office the other day, getting blood drawn, and the phlebotomist asked me what I was reading since I was carrying a book (I'd rather read when sitting in an examination room waiting for the doctor than stare at those charts of nasty medical illustrations on the walls and wondering which disease is eventually going to kill me).

I told him it was a book about math (which I'll review in a couple of days when I finish reading it).  He then asked if I taught math and I told him I was a geologist we talked for a bit.  He told me he was never very good at math (as most people will tell you if they see you reading a book about math for fun), and one his memories from a high school math class was his teacher yelling at the class - "You know why you kids do so badly on the test?  It's because you can't follow directions and that's what math is - following directions!"

He was done drawing my blood, so I didn't continue the conversation, but I was horrified that a math teacher would yell at his class like that.  Not because he yelled at the students - good for him, they probably deserved it and never followed instructions - but because he told them something I think is totally false.  Math, real math, is not simply "following directions".  I would contend just the opposite - that teaching math this way is the worst possible way to do it (to be fair, of course, I'm just going by some one's memory of a long-ago math class, reality may have differed).

Also keep in mind, in what follows, is that I'm not a math teacher.  I'm a geologist that likes math and think it's terribly interesting (I also find myself teaching elementary algebra to college students in my geology lab when they can't solve certain problems).  Take what I say with a grain of salt (perhaps a math teacher could chime in if they're reading this).

To be fair, a large part of math is "following directions" in that math has rules.  The plus sign + has a specific meaning in mathematics as an operation.  When doing something to one side of an equals sign, you also have to do the exact same thing to the other side.

The problem is when students reach college and think of math as simply a system of mysterious rules and formulas with zero understanding of how it all works.  That's why people always complain about "word problems" in math - if you don't understand the concepts, you can't apply them to solve a problem.

A concrete example.  Most people are aware that the Earth's rigid outer shell (called the lithosphere by geologists) is split into plates which drift around over geologic time.  This process is called plate tectonics and is central to modern science of geology.  The Pacific Ocean is mostly underlain by a plate called, not surprisingly, the Pacific Plate.

The Hawaiian Islands are in the middle of the Pacific Plate and formed from volcanic activity.  This is because that part of the plate is moving over a hot spot - a place where hot material is rising up through the mantle (a mantle plume) and generating magma at the base of the oceanic lithosphere (the "plate").  This magma erupts onto the seafloor and eventually builds up the volcanic islands we know as the tropical paradise of Hawaii.

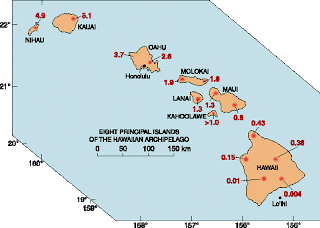
The diagram below illustrates this.  The hot spot is currently under the Big Island and Hawaii and that's why volcanoes like Kilauea are still erupting there.  One million years ago, the Big Island didn't exist and Maui was over the hot spot.  From 1.1 to 1.8 million years ago, Molokai was over the hot spot.  From 2.2 to 3.3 million years ago, Oahu was over the hot spot.  You get the idea.  That's why old volcanoes on Oahu are extinct, they don't erupt anymore.  Oahu moved off the hot spot over two million years ago - there's no more heat and magma to initiate volcanic eruptions.

So, after students have had lectures on plate tectonics, volcanism, etc., we have a lab where students are given a diagram similar to that below (red numbers are ages of volcanic features in millions of years) and asked to calculate the approximate rate of plate movement, in cm/yr (plate movements are almost always reported in centimeters per year) for the Pacific Plate over the past 5 million years.


The first thing many students ask is "What formula do I use?"  This is like a word problem in math where all of the information is given, but some students have no idea what to do with that information because they don't really understand what they're doing.  Then I explain that they need to calculate the velocity of the plate and ask them how velocity is defined.  We finally get to the fact that it's distance divided by time (cm/yr in our plate movement example).

Then some students will proceed to measure the distance from Hawaii to Kauai using the scale bar shown on the map and get a distance of about 550 km or so.   Then they'll divide that by 5,000,000 years and get an answer of 0.00011 cm/yr.  Other students will divide 550 km by 5 million years and get an answer of 110 cm/yr.  Nope, sorry to both, you completely ignored your units and got incorrect answers.  Very common.

The answer, of course, requires you to convert 550 km into centimeters (55,000,000 cm) and 5 million years into 5,000,000 years and then divide to get 11 cm/yr.  If I had simply posed the problem as "Find the distance in centimeters and the time in years and use the formula Rate = Distance / Time, they'd have no problem.  But, when the problem is left more vague, and relies on the understanding that rate is distance over time and that you have to pay attention to your units, many supposedly college-level freshman science majors fall apart.

Why?  Where's the disconnect?  I don't know.  I also get students who multiply instead of divide when working with map scales on topographic maps and tell me that the distance between features within Ulster County is millions of kilometers!  No number sense at all.

Another advantage of home schooling compared to public schooling (my wife and I homeschool our kids).  If they tell us "I don't understand word problems" we'll just concentrate on giving them word problem after word problem until they get it.  In public schools, once you're lost it's likely you'll remain lost.

Wednesday, November 16, 2011

Auroras

In this final post in my series on sunspots, I want to say a few words about auroras.

Coronal mass ejections (CMEs) from the Sun send out charged particles which interact with the Earth's magnetic field and atmosphere.  When these charged particles come into the Earth's outer atmosphere - the ionosphere - they interact with molecules there to create light. Since the easiest ways for the particles to enter the Earth's atmosphere is near the magnetic north and south poles, those are the areas that most often experience auroras (auora borealis near the North Pole and aurora australis near the South Pole).


The Earth's atmosphere is 78% nitrogen gas (N2) and 21% oxygen gas (O2) with 1% everything else.  It's in the ionosphere, also called the thermosphere, where the charged particles (ions) from the Sun first start coming into contact with these atmospheric gases.


As these charged particles come into the outer atmosphere some of them collide with electrons orbiting the oxygen or nitrogen atoms and knock them up to a higher orbital (energy state).  This excitation of the electrons is temporary and the electrons quickly pop back down to a lower orbital giving off energy in the form of photons of visible light as they do so.  The resultant glow from a myriad of these interactions is what forms the aurora.


The color depends on whether or not the molecule being excited in oxygen or nitrogen and it depends on the orbitals an electron is jumping between (from orbital 2 back to 1, from 3 to 2, from 3 to 1, etc.).  Each of these jumps gives off a photon with a characteristic wavelength of visible light energy.  Oxygen emissions tend to be green or brownish-red while nitrogen emissions tend to be blue or red (if both are occuring, a purple color can be seen).  Below is a nice aurora picture showing green, red, and purple light.


Green, however, is the most common color seen in an aurora.  Here's an amazing time-lapse view from National Geographic of mostly-green northern lights over Norway.  Their curtain-like, shimmering shape is due to the charged particles moving along the lines of force of the Earth's magnetic field.


Below is an image of the aurora borealis from the International Space Station (ISS) on September 29 as it orbited over the midwestern U.S. at night. Note the prominant lights of Chicago and St. Louis near the center of the image (from NASA's Earth Observatory web site).


Under favorable conditions, auroras can be seen here in the Hudson Valley (I saw a red one during the last sunspot cycle).  So, hw can you know if a CME erupts during this sunspot cycle and there's a chance to view auroras here in the Hudson Valley (or wherever you live)?  I use SpaceWeather.com which has handy email elerts you can sign up for (in addition to having lots of other neat information).

Tuesday, November 15, 2011

Sunspots & the Earth

In previous posts, I introduced sunspots, discussed sunspot cycles, and tried to explain why the Sun has sunspots.  As a professor, I'm used to getting the "Why should we care?" argument from students.  My stock answer, expressed a bit more eloquently, is that it's fucking interesting.  But, in the case of sunspots, there are valid reasons why we, as a society, should be interested in them.  Check out this video.


This is a coronal mass ejection (CME) - a massive release of electromagnetic energy and ionized (charged) particles, mostly electrons and protons.  If the event occurs on the side of the Sun facing the Earth, electromagnetic energy from across the spectrum, long-wavelength radio waves to short-wavelength gamma rays, travel to Earth at the speed of light taking only 8.5 minutes or so to get here.  The stream of charged particles takes a bit longer to reach the Earth traveling, on average, about 500 km/s although sometimes reaching speeds of 2000 km/s.  Since the Sun is 150 million km away, it will take the charged particles anywhere from 1-4 days to arrive (depending on their speed).

These eruptions of energy on the Sun are associated with active regions - in other words sunspots.  They're not well understood but are thought to occur when lines of magnetic force break and reconnect releasing stored energy.  As much energy as a billion hydrogen bombs!

What are the consequences of this here on Earth?

Fortunately, here on Earth, we're shielded from much of the dangerous electromagnetic radiation (gamma rays and x-rays) and high-energy charged particles by the Earth's atmosphere and magnetic field.  Future astronauts on the surface of the Moon, or traveling on a ship to Mars, could get radiation poisoning or even be killed by such events (astronauts aboard the International Space Station are in a low-Earth orbit and still somewhat shielded from such events).

OK, you're thinking, I'm not planning a trip to Mars anytime soon so what's the worry?  The problem is that with a large enough CME, our atmosphere and magnetic field become a bit overwhelmed and there are effects here on Earth - some harmless and some more serious.

Our Earth has a magnetic field generated by the rotation of liquid iron in the outer core.  This field normally deflects away the constant stream of charged particles from the Sun (the solar wind).  This solar wind compresses the Earth's magnetic field on the side facing the Sun and stretches it out on the far side into a tail.


During a CME, so many charged particles (ions) interact with the magnetic field that some are able to leak down toward the Earth in the vicinity of the north and south magnetic poles.  Some get trapped in a doughnut-shaped ring called the Van Allen radiation belt and others spiral into the upper atmosphere (called the ionosphere).  These results in auroras.


More on auroras in a bit while we first take a short digression and talk about satellites and power grids...

Satellites are greatly affected by the charged particles released during a CME.  Most satellites don't orbit in the vicinity of the Van Allen belt, but those that do need to have their electronic components radiation hardened to survive.  Satellites in higher orbits are susceptible to damage from the high-energy particles from CMEs.  High energy electrons can physically damage the electronics and solar cells of satellites and even scramble the data stored in computer chips.

Large CME events can also compress the magnetosphere (the magnetic field "bubble" around the Earth) leaving the satellite outside of the protection of the magnetic field and more vulnerable to damage.  In addition, since satellites often use the Earth's magnetic field for guidance, this can disrupt their attitude control systems.  In 1997 and 1998, during the last sunspot cycle, a number of satellites were damaged from CMEs including the AT&T Telstar 401, PanAmSat Galaxy IV, and several Motorola Iridium satellites.  Almost a billion dollars in insurance claims were paid out in 1998 for satellite failures in orbit.

Low-Earth orbit satellites can also suffer from CMEs.  During a CME, the added energy into the Earth's atmosphere causes it to expand.  This creates increased frictional drag on these satellites reducing their orbital life-span.

There is another effect CMEs can have as well.  Large CMEs can induce currents in electrical lines here on Earth.  In March of 1989, two solar cycles ago, a large CME caused the power grid in Quebec to go down resulting in six million people losing power.  Are we still vulnerable 20+ years later?  More so than ever - check out these images from a recent study of this issue (click on the images to enlarge and read the captions).


It's theoretically possible for a large CME to knock out half of the U.S. power grid for weeks to years!  Think about that when wondering if it's worthwhile funding scientific research of the Sun.

Next time I'll post about auroras but for now I'll leave you with some information about the solar "superstorm" or 1859 (thought to be a once in every 500 years event).

On September 1, British astronomer Richard Carrington observed a large CME erupt from the Sun which took only 18 hours to reach the Earth (a velocity for the particles of over 2,000 km/s).  This triggered a massive geomagnetic storm on Earth resulting in auroras seen around the world (most notably down in the Caribbean!).  There were reports of people here in the Northeast being able to read newspapers by the light of the auroras at night.  Telegraph systems throughout the world failed.  Sparks flew from wires, operators received electrical shocks, and telegraph paper even caught fire.

Such an event today, in our electrified, wired world, would be literally catastrophic.

Sunday, November 13, 2011

Why do we have sunspots?

In my last post, I talked about solar cycles and sunspots but I didn't explain what exactly sunspots were and how they formed.

First, to recap, we know that there is a roughly 11 year sunspot cycle where we go from essentially no sunspots on the surface of the Sun to a period of high sunspot activity and then back to essentially no sunspots again.


It also turns out that sunspot position on the Sun is not random.  Graphing where sunspots appear during the sunspot cycle yields the famous "Butterfly Diagram" showing that, at the start of the sunspot cycle, sunspots initially appear near ±30° of latitude and then, as the cycle progresses, sunspots appear closer and closer to the equator.

Keep in mind that the sunspots themselves don't move (although they appear to from Earth during the rotation of the Sun) but form, typically exist for a couple of weeks or more, and then dissipate.  Where they pop up on the surface of the Sun, however, is what changes during the sunspot cycle and is reflected on the butterfly diagram above.

What else have we learned about sunspots?

Well, a sunspot can be over 50,000 km across (for reference, the diameter of the Earth is about 12,750 km) and consists of two visible parts - the darker central umbra (Latin for shadow) and the lighter surrounding penumbra (the Latin prefix means almost or nearly).  The image below shows a large sunspot group (AR 1339 from November 4) with a filtered telescope.  Note the clearly visible umbra and penumbra for each sunspot.

Sunspots are darker than the surrounding Sun because they're cooler.  The surface of the Sun is around 6000 K (over 10,000° F) and sunspots are 1500 K (~2250°) or more cooler.  So, while they appear dark compared to the rest of the Sun, if you could somehow take a sunspot off the Sun and place it by itself in space, it would glow brightly in the sky!


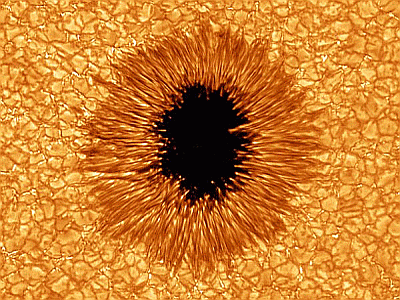
The next image shows a sunspot a bit more dramatically.  This image was taken in August of 2010 at the Big Bear Solar Observatory in the San Bernadino Mountains of California.  This image was taken with a special filter called a hydrogen alpha (Ha) filter. It's a filter that only passes a narrow bandwidth of visible light at a wavelength of 656 nm (6.56 x 10⁻⁷ m). This is the energy given off by electrons in a hydrogen atom falling from the 3rd to the 2nd orbital. The Sun, being a big ball of mostly hydrogen gas, gives off a lot of energy at this wavelength and these filters bring out a lot of detail on the "surface" (photosphere) of the Sun.


This image shows a granulation around the sunspot.  Those are the tops of convection cells where hot gases are "bubbling" up from deeper in the Sun.  Here's a neat animation of solar activity.


This convection of hot, ionized gas (plasma) generates the Sun's magnetic field.  Because the Sun is a big ball of gas, it doesn't rotate at the same speed everywhere - it takes about a 9 days less to rotate at the equator (~25 days) than it does near the poles (~34 days).  This differential rotation leads to magnetic flux tubes in the convection zone of the Sun getting twisted up (they actually behave much like rubber bands).  This inhibits convection and leads to the development of a cooler sunspot (don't ask me to explain this any better since I'm not a solar physicist).


Magnetic lines of force also pop up above the photosphere often leading to the formation of two sunspots of opposite magnetic polarity (one where the magnetic field emerges from the photosphere, the other where it reenters the Sun).  Sunspots have about 1000 times more magnetic energy than surrounding areas of the Sun.

Below is a magnetogram image of the Sun for today (November 13).  Black indicates areas where the Sun's magnetic lines of force are coming toward us and white indicates areas where the Sun's magnetic lines of force are moving away from us.  Compare this to the visible image of the Sun for today and you can see that major black and white areas correlate with the positions of sunspots.


Another interesting thing about the magnetic field of the Sun is that it has a 22-year cycle.  Every 11 years it reverses its polarity (i.e. the north and south magnetic poles flip).  Obviously closely tied into the 11-year sunspot cycle!
Anyway, models to explain this 22-year cycle are all based on the differential rotation of the Sun affecting the internal convection and thus changing the magnetic field over time.  If the Sun rotated faster or slower, or the convection zone was thicker or thinner, or convection was faster or slower, this cycle would be different.  The details are messy and I don't understand them myself (phrases like "...regeneration of the poloidal field by lifting and twisting a toroidal flux tube by helical turbulence..." follow by a page of equations are typical in the literature.

So, you may be thinking, sunspots are cool looking features on the surface of the Sun that we don't fully understand but do they have any significance for us here on Earth?  Yes, as a matter of fact they do.  That will be the topic of the next post.

Saturday, November 12, 2011

Sunspot cycles

In a previous post, I had discussed how Galileo had begun making systematic observations of sunspots with a telescope starting in 1610.  Science has been observing sunspots ever since.  This led to the discovery of a sunspot cycle in 1843 by German astronomy Samuel Heinrich Schwabe (1789-1875).  This cycle averages 11 years (rounded off) but can range from 9 to 14 years in length.

Solar maximum                                                             Solar minimum

Each 11-year cycle goes from a solar minimum to a solar maximum and then back to a solar minimum again.  At a solar maximum, there are a lot of sunspots on the surface of the Sun. At a solar minimum, there are few to no sunspots.


The numbering scheme for solar cycles was developed by Swiss astronomer Rudolph Wolf (1816-1893) who began with the cycle starting in March of 1755.  The last solar cycle, number 23, peaked around April 2000 and we're currently in cycle 24, which began on January 8, 2008, and is expected to peak in May of 2013.  The current solar cycle seemed to be slow getting started and has exhibited about 50% less sunspot activity than expected.

One of the interesting things about the sunspot cycle is that its intensity varies cycle to cycle - at least over the past few hundred years of observation.  Keep in mind that the Sun has been around for four-and-a-half billion years.  If sunspot cycles have always averaged 11-years (highly improbable), then there would have been over 400 million sunspot cycles (and we've only observed a couple of dozen!).  Astronomers have been carefully observing, with satellites, only for the past couple of cycles.

Shortly after the earliest scientific studies of sunspots by Galileo, the Sun went quiet.  From about 1645 to 1715, sunspots practically disappeared from the Sun (that's a span of six or so sunspot cycles).  It's been named after English astronomy Edward Maunder (1851-1928).  Other minimums include the Dalton Minimum (1790-1830) and the Spörer Minimum (1460-1550) named for an event identified by the radiocarbon (14C) concentration in tree rings (14C is produced in the atmosphere strongly correlates with solar activity).


In more modern times we seem to be in a period of increased solar activity (except for the current sunspot cycle).  One of the most intense cycles was number 19 which peaked around 1960.  Why the variations?

I'll save that for the next post...

Friday, November 11, 2011

11/11

Wow, it's 11:11:11 on 11/11/11.  Cool.  Waiting for something wonderous to occur...  Anything...  No???  Just another banal moment on a Friday morning???  How disappointing.

Anyway, even though the magic of numerology didn't work for me today, I did want to say thanks to all those veterans and active duty military out there!

"We sleep soundly in our beds because rough men stand ready in the night to visit violence on those who would do us harm."
[Attributed to Winston Churchill]

While I don't always agree with what out government does with our military, there are a lot of people out there who wish us harm simply because we don't believe the way they do, and I certainly support the men and women in uniform who stand ready to risk their lives in our defense.

Thursday, November 10, 2011

Sunspots & the Sun's Rotation

As my previous post mentioned, I had a sunspot observation on campus Tuesday afternoon.  It went well.  Most of the students seemed to enjoy seeing the sunspots, some were blase about it, and others walked by with no interest whatsoever even when asked if they'd like to see the Sun through a telescope.

The right image is from today at 2100 UTC (4:00 pm EST) and the left image is 4 days earlier.  Note how the sunspots move because the Sun is rotating on its axis.  It takes about 25 days for a rotation (at the equator, it takes longer as you move toward the poles due to the fact that the Sun is a big ball of gas, not a rigid body).  One can observe sunspots and easily work out this rotational period.


While there are scattered references to sunspot observations with the naked eye from ancient Chinese and Greek observers, Galileo was one of the first to observe them with a telescope starting in 1610 and he was able to show that they were actual features on the surface of the Sun and moved as the Sun rotated.


In the Aristotelian cosmology which still ruled in the early 1600s, and which was backed by the Roman Catholic Church, the Sun was a perfect and unblemished celestial body.  In was inconceivable to some that it had darks spots on it.  Christoph Scheiner (1573-1650), a Jesuit priest/astronomer, was one and he argued that these dark spots represented small satellites orbiting the Sun.

Careful observations by Galileo, however, showed that the sunspots moved more slowly when they were near the limb of the Sun and more quickly when they were in the center of the Sun.  This was due to foreshortening as shown in the diagram below.  A sunspot moving from A to D would travel the same distance as from D to C.  From the Earth, however, the A-D distance looks shorter than the D-C distance.  That makes it appear as if the sunspot was moving faster between D and C.


The idea that heavenly objects like the Sun were perfect and unblemished held sway for over 1,500 years because people philosophically liked the idea and it conformed to their religious beliefs.  A few simple observations, however, was all that was needed to topple this incorrect view.  No wonder the religious authorities of the day (and even some today) hated science.